
Income-hungry investors are often drawn to Business Development Companies (BDC) because of their high dividend yields (many of them are currently in excess of 10%). Generally speaking, it can be a red flag when a publicly-traded investment yields in the double digits, perhaps a sign of distress. However, the BDC space may be ripe for the picking considering many of these high-yielding companies trade at a discount to their net asset values (NAV) and show signs of financial strength. In particular, we consider the merits of Prospect Capital Corporation (PSEC) a BDC with a 14% dividend yield that trades at a significant discount to its NAV, and exhibits lower volatility and an attractive entry-point for income-hungry investors.
Why is Prospect’s Dividend Yield so High?
For starters, it’s a Regulated Investment Company (RIC) and a BDC. This means Prospect pays little to no corporate income tax as long as it pays out at least 90% of its income as dividends (BDCs were created by Congress in 1980 to help grow small businesses). Whereas many other publicly-traded companies retain a large portion of their earnings to fund future growth. For this reason, BDC’s like Prospect have relatively large dividend payments.
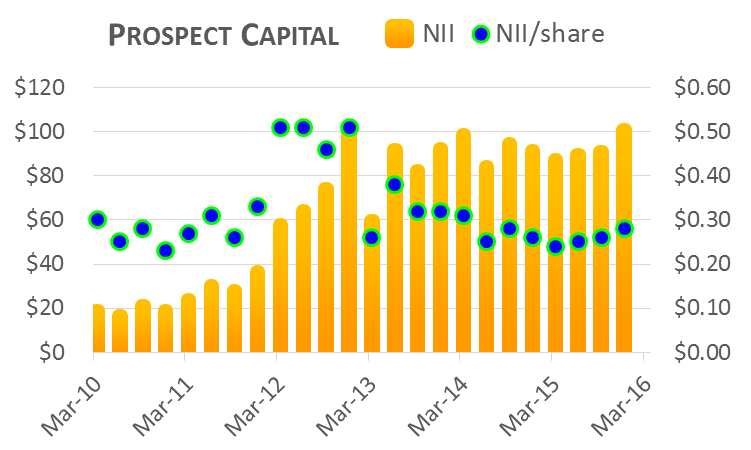
Next, let’s consider Net Investment Income (NII). NII is one of the most important factors in evaluating a BDC because it measures income received from investments minus expenses related to those investments. It’s basically a measure of a BDC’s ability to maintain its dividend. In the case of Prospect, its most recent quarterly net investment income was $0.28 per share and its dividend payments per quarter are $0.25 per share. This is a good thing because it means Prospect’s NII covers its dividend payments. (Note: Prospect pays dividends monthly in the amount of $0.083 per share). As another sign of strength, Prospect’s total NII has been growing. The following chart shows Prospect’s total NII and NII per share.
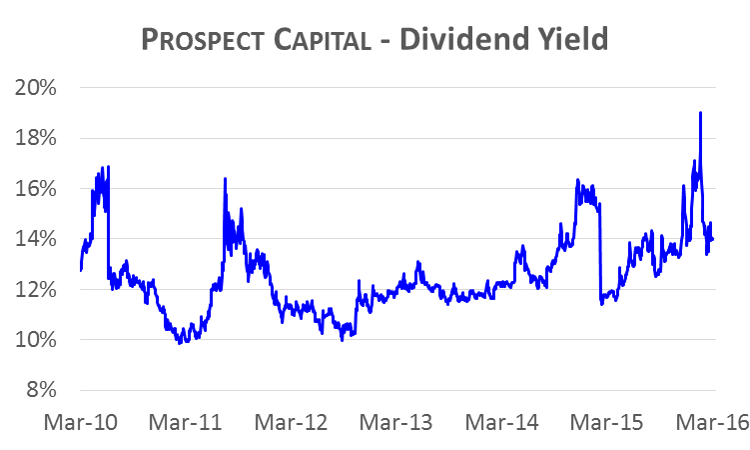
Another reason why Prospect’s dividend yield is so high is because its share price has fallen (mathematically as price falls, yield increases). The following chart shows Prospect’s historical dividend yield.
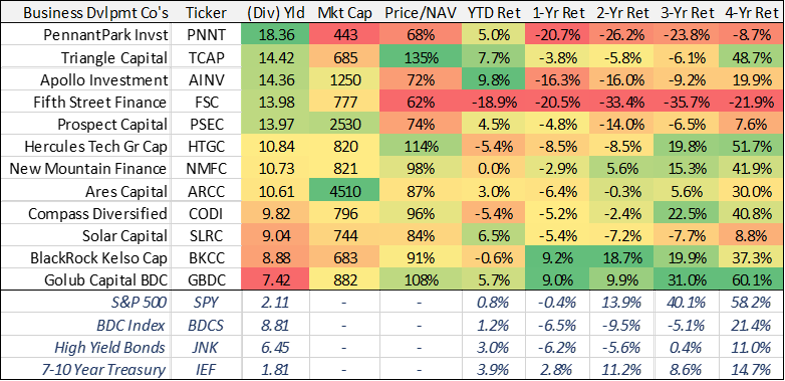
And for reference, this table contains a variety of additional information on Prospect as well as some of its closest peers.
Why has Prospect’s Price Fallen?
As the above table shows, Prospect has delivered a negative return over the last 1-, 2- and 3-year periods, and has not performed that great relative to the S&P 500. Keep in mind these are total returns (dividends plus price appreciation), so even after considering Prospect’s big dividend payments, it has still performed poorly.
The reason for the poor performance among BDCs in general is the perceived risk. Specifically, a large portion of many BDC’s business (including Prospect) is to make loans to riskier small- and mid-sized companies. In fact, the following table shows the correlation between an index of BDC’s (BDCS) and high-yield/high risk bonds (JNK) is 0.91. This says a lot about the types of investments BDCs make (they’re making high risk loans) and the market’s perception of the risk (they generally trade similar to high yield bonds).
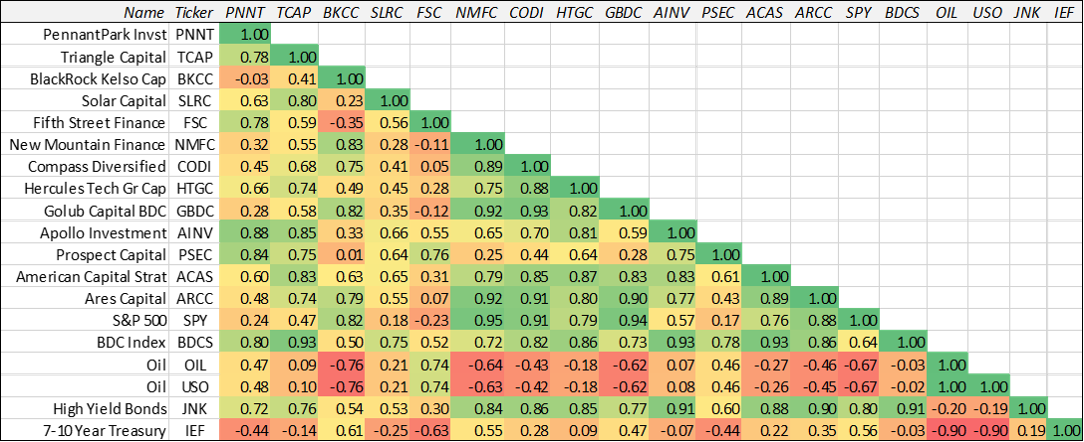
PSEC’s individual correlation with high yield bonds (JNK) is only 0.60, suggesting it is less correlated than other BDC’s and also suggesting the quality of PSEC’s investments may be higher quality than other BDCs. According to PSEC’s most recent investor presentation, “71% of [their] portfolio [is] comprised of first-lien and second-lien loans, the majority of which is first-lien.” Additionally, PSEC has strong investment-grade ratings. Specifically, Prospect’s credit facility rating is Aa3 by Moody’s. And its corporate rating is BBB+ by Kroll and BBB- by S&P. (source: investor presentation, p.3).
Considering Prospect’s relatively lower correlation with high yield bonds and it’s stronger correlation (0.78) with the overall BDC Index (BDCS), Prospect may have sold off a little more than it should have (i.e. some market participants may have inappropriately thrown Prospect into the same basket as other BDC’s and indiscriminately sold it driving down its price).
Another interesting topic to consider is PSEC’s exposure and relation to energy assets. Considering the sharp decline in oil prices since the second half of 2014, many high-yield bond funds have sold off (not entirely orderly) because of that category’s exposure to energy (an increased number of energy-related companies are expected to file for bankruptcy). Considering BDCs and high-yield bonds have historically been highly correlated, it’s possible many investors made the psychological mistake of selling off Prospect believing it faces the same energy-related risks as high-yield debt. Our correlation table above shows a high correlation between Prospect and oil (0.46) relative to other BDCs. In reality, Prospect has a very low energy asset concentration of 3.5%, the majority of which is secured debt. (source: investor presentation, p.3). This is perhaps a contributor to Prospect’s stock price selling off more than it should have. As the following graph shows, Prospect (and BDC’s in general) sold off with oil prices to a larger extent than the overall market (S&P 500).

Signs of Value
The following graph shows Prospect currently trades at a discount to its Net Asset Value (NAV), and it is priced attractively relative to its historical Net Investment Income (NII).
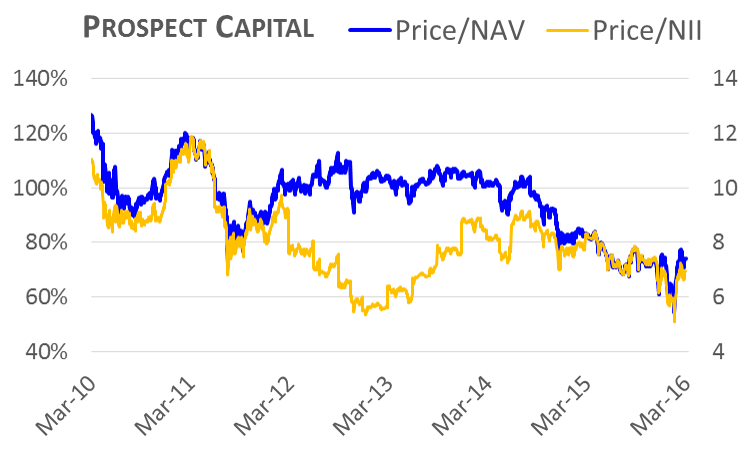
The NAV is simply the book value of Prospect’s net assets (total assets minus total liabilities), and it doesn’t even take into consideration the company’s future earnings power. Further, Prospect’s price-to-NII (~7x) is near the lower end of its recent historical range, suggesting it is not necessarily overvalued. Worth noting, Prospect points out in its most recent investor presentation that it has historically delivered strong returns following periods of trading at a discount to its net asset value.

Also worth noting, Prospect has delivered significantly higher risk-adjusted returns than its BDC peers over the last 5-years, as the following graph shows.

Further, Prospect has a lower beta (0.70, per Google Finance) than the overall market thus allowing for some important diversification benefits within an investment portfolio.
Additionally, according to Prospect’s most recent annual report, they ‘intend to unlock value by “spinning off” certain “pure play” business strategies.’ (annual report, p.3). Collectively, the spin-offs are expected to amount to approximately 10% of the company’s asset base, and management believes this could help raise Prospect’s currently discounted share price.
Risks
Prospect faces a variety of risks, and a significant economic downturn is probably the biggest. For example, if the economy were to experience a dramatic downturn as was the case during the financial crisis of 2008-2009, Prospect would be seriously challenged. The value of their assets would decline as investment counterparties would be unable to meet financial obligations. Even though Prospect is well-diversified across 28 industries and with 130 investment counterparties, another financial crisis would likely cause significant financial challenges for the company.

Sharply rising interest rates also pose a significant risk for Prospect. Rising rates could increase the default risk among Prospect’s investment counterparties. According to Prospect’s most recent investor presentation (p.3), the company is “positioned well for rising interest rate environment as 90% of interest bearing assets are floating rate and approximately 98% of liabilities are fixed rate.” However, if investment counterparties are unable to meet obligations in a rising rate environment, that spells trouble for Prospect.
Failure to meet (or changes in) regulatory requirements pose a risk for Prospect. For example, if Prospect is unable to allocate a sufficient portion of its investments to qualifying assets then it may not qualify as a BDC. Similarly, if Prospect doesn’t pay out at least 90% of its income as dividends then it could fail to qualify as a Regulated Investment Company. These requirements could cause Prospect to lose its corporate tax exemptions and/or prevent it from investing in the best assets/opportunities available.
Prospect Capital Management’s fee structure poses another significant risk for investors considering potential carried interest tax changes posed by most of the leading U.S. Presidential candidates. Prospect Capital Corporation is managed by Prospect Capital Management (PCM). PCM’s base management fee is 2% of gross assets plus 20% of capital gains in excess of 7% (source). For perspective, this chart from Prospect’s investor presentation (p.25) shows the total management fee for 2015 was $0.63 per share, or approximately 9% of its current share price.

Nine percent is an enormous fee! The leading presidential candidates (both Clinton and Trump) believe companies (e.g. PCM) should be paying a higher tax rate on the carried interest portion (the 20% part) of their management fee. And if the tax rate is increased, it will likely result in PCM requiring an even larger management fee to make up for the lost income due to an increased tax rate on carried interest capital gains. This would be bad for Prospect’s share price. Additionally, this management fee structure may incentivize PCM to take unnecessary risks considering the lopsided fee structure that works in their favor.
Conclusion
Prospect Capital offers a big (+14%) dividend yield, and its shares are currently on sale. The shares are trading at a discount to the company’s net asset value, and they are attractively priced at 7-times net investment income. The attractively low price multiples may be the result of somewhat unwarranted fears related to BDCs in general, high yield bonds, and low energy prices. However, the low market valuation is providing an attractive entry point for income-seeking investors. Barring broad risks such as a sharp economic downturn and carried interest tax reform, Prospect could be an extremely valuable addition to a diversified income-focused investment portfolio.