

If you are an income-focused investor, you’ve likely considered PIMCO’s popular big-yield bond funds (often yielding in excess of 10%, paid monthly). You may have also considered BlackRock funds (although many perceive them as second rate to PIMCO). In this report, we compare high-level data on 10 big-yield bond funds (from PIMCO and BlackRock), and then dive deeper into PIMCO’s 14% yielding Dynamic Income Fund (PDI), including a discussion of its risks (such as leverage, interest rates, insufficient distribution coverage, confounding interest rate swaps and the potential for delayed recognition of “Return of Capital” that was previously taxed as ordinary income). We conclude with our strong opinion on investing.
10 Big-Yield Bond Funds
Just to get some data in front of you right from the start, here is a look at recent data for 10 big-yield bond funds from PIMCO and BlackRock (all of them pay monthly). As you can see, the annualized yields are impressive.
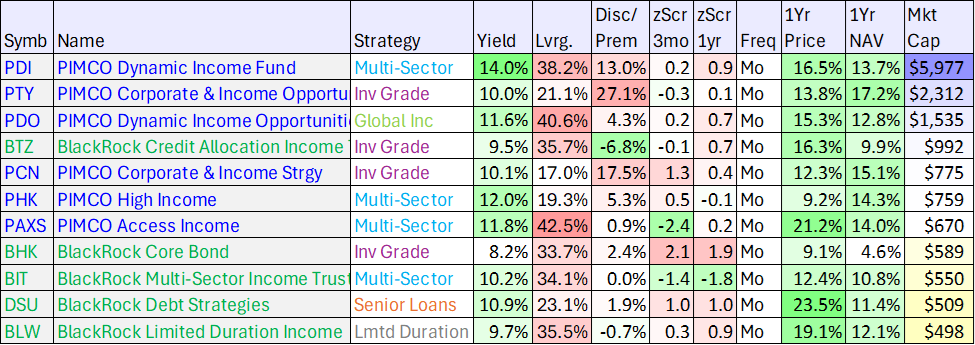
(source: CEF Connect)
You likely recognize many of your favorites in the table above, and hopefully you also appreciate the comparative data (which we will refer back to throughout this report). You may also notice that certain PIMCO funds use higher leverage (or borrowed money) which can magnify returns and income in the good times, but also magnify losses in the bad times.
Also important to note, the PIMCO funds generally trade at bigger premiums than BlackRock funds (some of which currently trade at discounts). This is largely a reflection of investors’ preference for PIMCO as the premier bond CEF manager over BlackRock. And we’ll have more to say later about what one group of activist investors (Saba Capital) is doing in response to BlackRock’s relatively weaker prices (versus NAV).
And for a little more perspective, here is a look at total returns and price returns in recent years (you’ll notice markets have been choppy as the fed hiked rates).

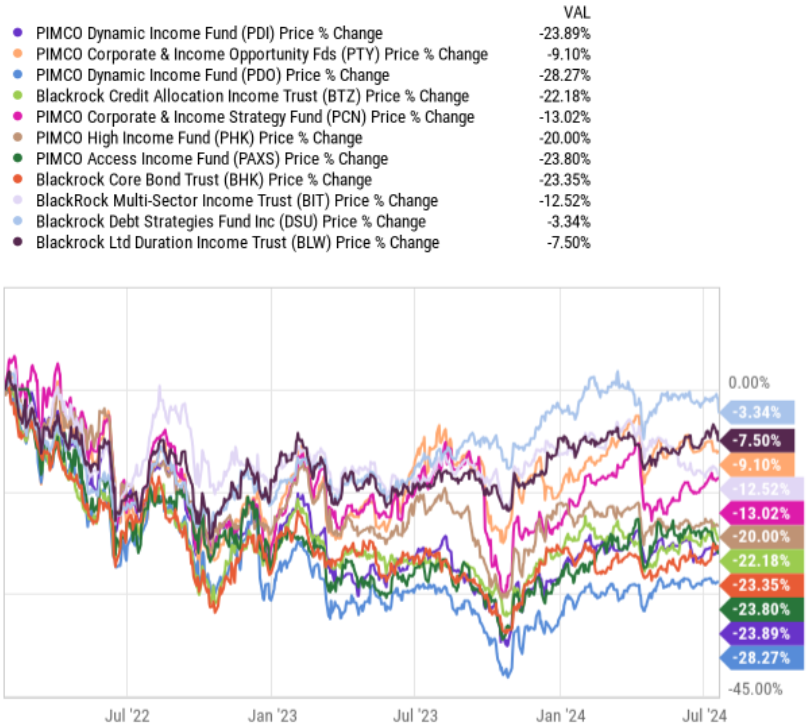
As you can see above, price returns have been negative, but total returns (price returns plus distributions as if they had been reinvested) have been better.
And to add a longer-term view, here are the returns since 2013 (for a few of the funds that have been around that long).
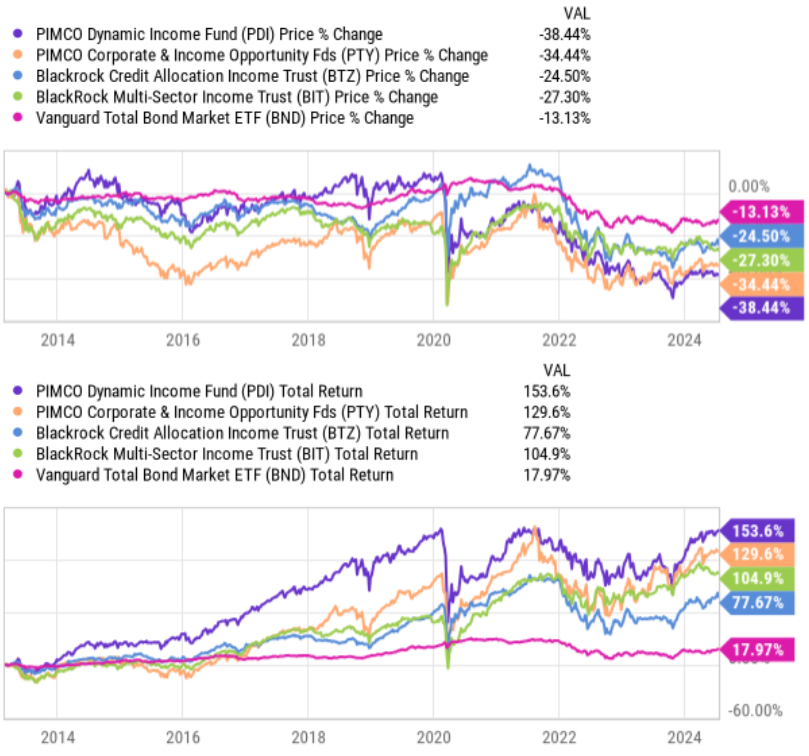
Again, as you can see (above), price returns have been negative (rising rates have created challenges), but total returns (price plus distributions as if they had been reinvested) have been stronger.
What Is a Closed-End Fund (CEF):
Before getting into the specifics on individual funds, it’s first worth reviewing what a closed-end fund is. As we’ve written in the past:
A closed-end fund is an exchanged traded product that can offer a big attractive distribution yield. Its price fluctuates throughout the course of the trading day based on a combination of its net asset value (the aggregated market value of the individual holdings within the fund) and supply and demand.
The supply and demand dynamics of a closed end fund can cause it to trade at a significant premium or discount versus its NAV throughout the course of the day (and over time), especially versus exchange traded funds (ETFs). Unlike CEFs, ETFs have creation units where ETF management can create more shares of the ETF through the open market which helps keeps the discount/premium on an ETF small (generally only a few basis points). On the other hand, CEFs have no creation units (they’re closed-end) and therefore CEFs can trade at large discounts and premiums relative to their NAVs thereby creating opportunities and risks.
CEFs come in many shapes and sizes. Examples of CEF categories include diversified equity funds, sector funds, corporate bond funds, commodities funds, and asset allocation funds, to name a few.
7 Questions to Ask Yourself Before Investing
Also for your reference, here is a list of 7 questions you should ask yourself before investing in any closed-end fund
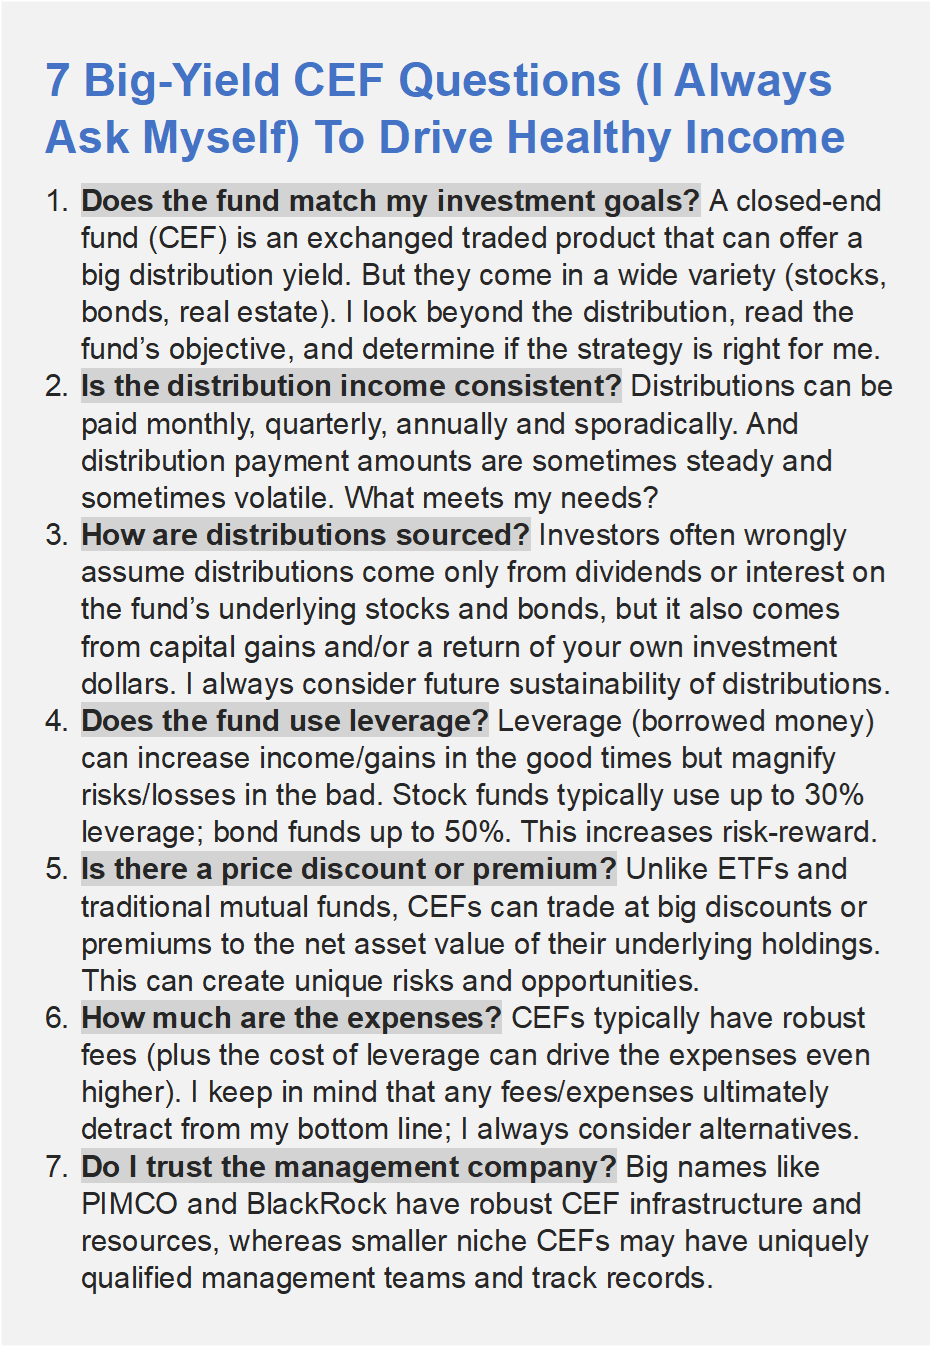
We’ll refer back to these questions (above) throughout this report.
How is the distribution sourced:
One bond-CEF question in particular that is worth considering is how is the distribution sourced (especially considering neither BlackRock or PIMCO seem to be covering theirs as per the recent data below).

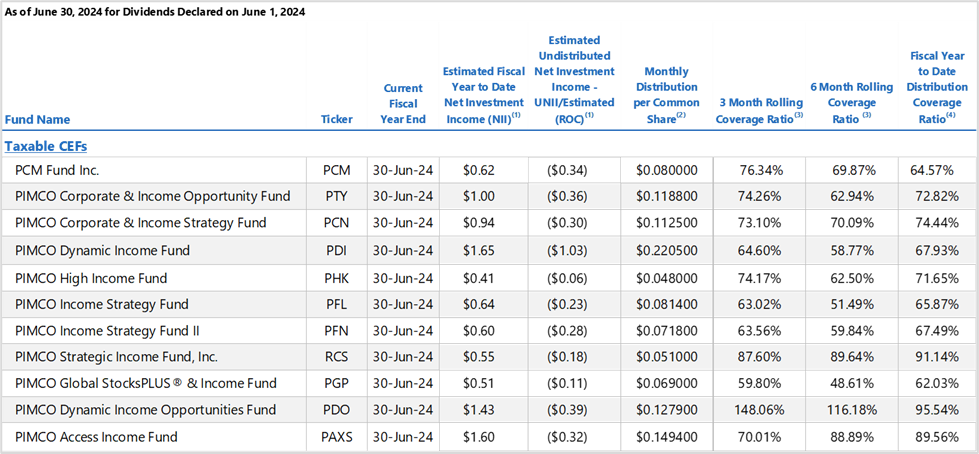
As you can see in the table above, these popular funds have coverage ratios below 100% (i.e. a risk, especially over the longer term).
The distributions are generally covered through a combination of interest income on the underlying bond holdings, plus capital gains, and potentially a return of your own capital (and all of this can be magnified by any use of leverage).
We’ll have more to say about the specific PDI distribution sources (especially something called “Paid-in Surplus or Other Capital Sources," which is similar to a return of your own captial) later in this report.
Expenses:
Another important consideration for these funds is the expense ratio, which can be significant (see table below), considering the already significant “interest expense” (on borrowed money for leverage, as mentioned earlier) is rising as interest rates have risen.
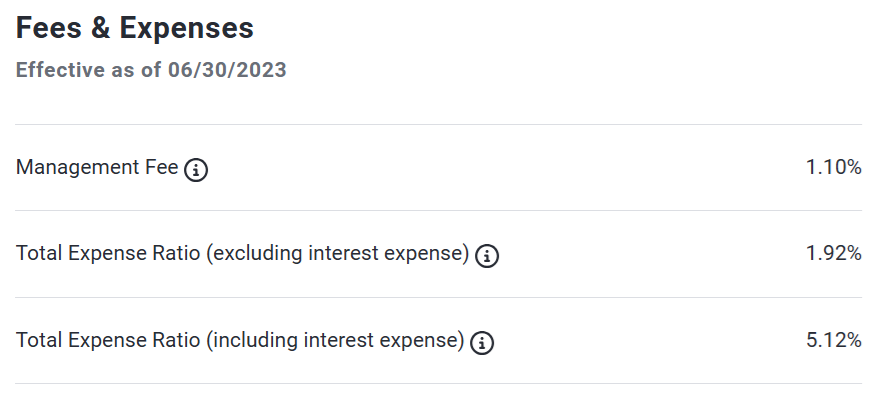
In the case of BlackRock and PIMCO, we are generally okay with the expenses because the funds invest in bonds, derivatives and leverage in ways that are really not feasible for the typical individual investor to implement on their own. Nonetheless, the expenses are significant and should be monitored.
Saba Capital
Before going deeper into the PIMCO Dynamic Income Fund specifically, it’s first worth briefly mentioning what has been happening with BlackRock. BlackRock is an outstanding fund manager with significant resources and economies of scale, but again they are often considered “second rate” versus PIMCO.
As a result, activist investor Saba Capital has been trying to replace the BlackRock board for several CEFs in an effort to improve performance (particularly the discounts versus NAV). Saba has lost so far, but BlackRock has also taken steps to reduce the discounts, a win for investors thus far.
PIMCO Dynamic Income Fund (PDI), Yield: 14.0%
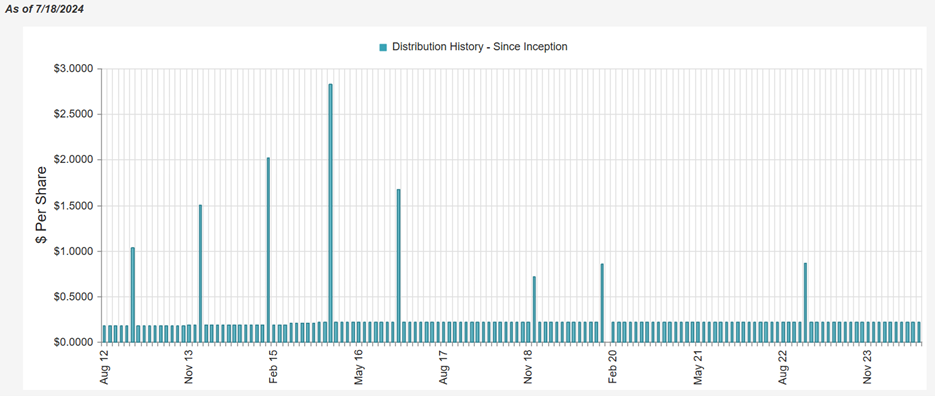
PIMCO’s popular Dynamic Income Fund (the largest in our earlier table, by assets) has a primary objective of current income (and a secondary objective of capital appreciation). You can see below, the fund has a successful long-term track record of delivering current income (i.e. distributions), but has struggled somewhat with capital appreciation (as the price has fallen over time, see earlier charts).
And for some perspective, here is a look at the types of investments PDI holds (i.e. it is diversified across variosu bond types).
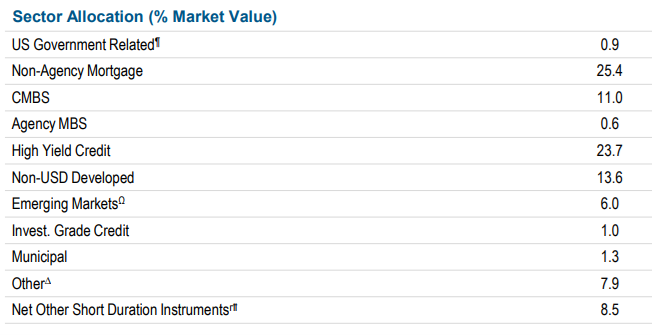
source: PIMCO Dynamic Income Fund (PDI)
Noteworthy, this fund also uses a significant amount of leverage (or borrowed money) as mentioned earlier, and carries a large amount of “Risk Free Rate,” “Secure Overnight Financing” arrangements.

Interest Rate Volatility: Post Pandemic
Many investors have been traumatized by PDI’s post-pandemic price volatility (which we saw in our earlier chart, and which has been largely driven by historically rapid changes in interest rates), while others couldn’t have cared less as long as the fund kept paying those big monthly distributions (which it did, as we saw earlier).
And now going forward, according to PIMCO:
“The post-pandemic inflation shock and rate-hiking cycle produced a generational reset higher in bond yields, creating a compelling multiyear outlook for fixed income as inflation recedes and risks build in other markets.”
For a little pespective on this, CEF Connect reports the average PIMCO bond holding trades at around 84 cents on the dollar, suggesting there may be signficant price appreciation ahead (as the bonds move towards maturity and $1.00 par).

Distribution Coverage: ROC Vs. Other Capital Sources
We saw earlier that big-yield bond funds (from PIMCO and BlackRock) have not been covering their distributions with net investment income or realized gains, so that begs the question “how have they been covering them?”.
In PDI’s case, the fund has been using “Paid-in Surplus or Other Capital Sources,” which has economic similarities to ROC (return of capital), but they’re not the same.

Return of Capital is something many investors despise, and PIMCO has done an exceptional job of not reporting too much ROC throughout history (something many investors love), unlike BlackRock (who has reported a lot of ROC).
In PDI’s case, one way they have been able to avoid ROC is through interest rate swaps which allow the fund to:
“generate current income and gains taxable as ordinary income sufficient to support monthly distributions even in situations when the Fund has experienced a decline in net assets.”
Very clever of PIMCO.
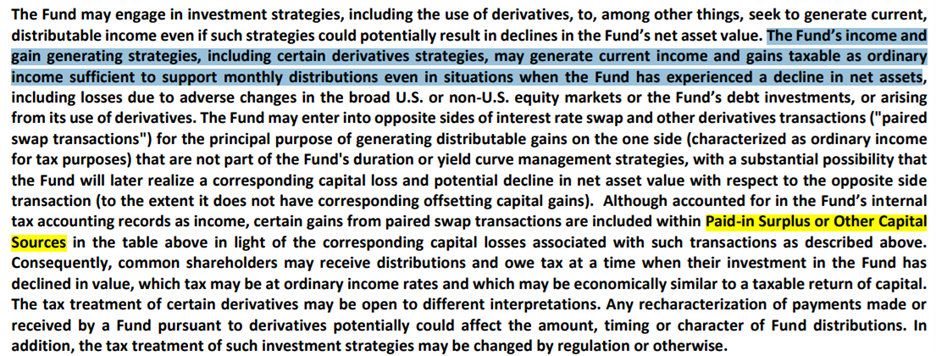
Another impressive thing about PDI’s use of derivatives is the strategy allows them to avoid the dreaded Section 19 Notices (which are required when a fund sources part of its income with ROC).

Specifically, the use of derivatives (mainly interest rate swaps) allow PDI to categorize what may otherwise have been (and what may be recategorized in the future as) ROC instead as “Paid-in Surplus or Other Capital Sources” which is a big win in many investors’ minds.
Just be aware that these items may be recategorized as ROC in the future, which means investors may be paying ordinary income taxes on distribution payments that they shouldn’t be (i.e. ROC isn’t taxed up front, instead it reduces your cost basis, and you may receive an unexpected tax bill when you sell if you have higher capital gains taxes as a result of your lower cost basis). Here is how PIMCO explains it:
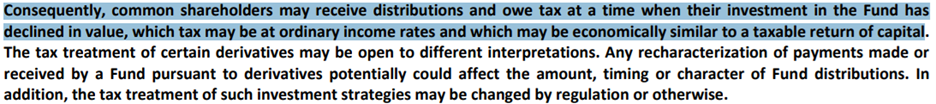
Worth mentioning, PDI’s long-term price declines (as we saw earlier) may potentially help offset “Paid-in Surplus or Other Capital Sources” which may be recategorized as ROC in the future (i.e. good for your tax bill) if you own in a taxable account).
Why is PDI’s Yield Higher Than the Others?
PDI has maintained its steady monthly distribution (something many investors love) with very little technical ROC (another thing many investors love) despite a volatile history in recent years (especially dramatic post-pandemic interest rate volatility).
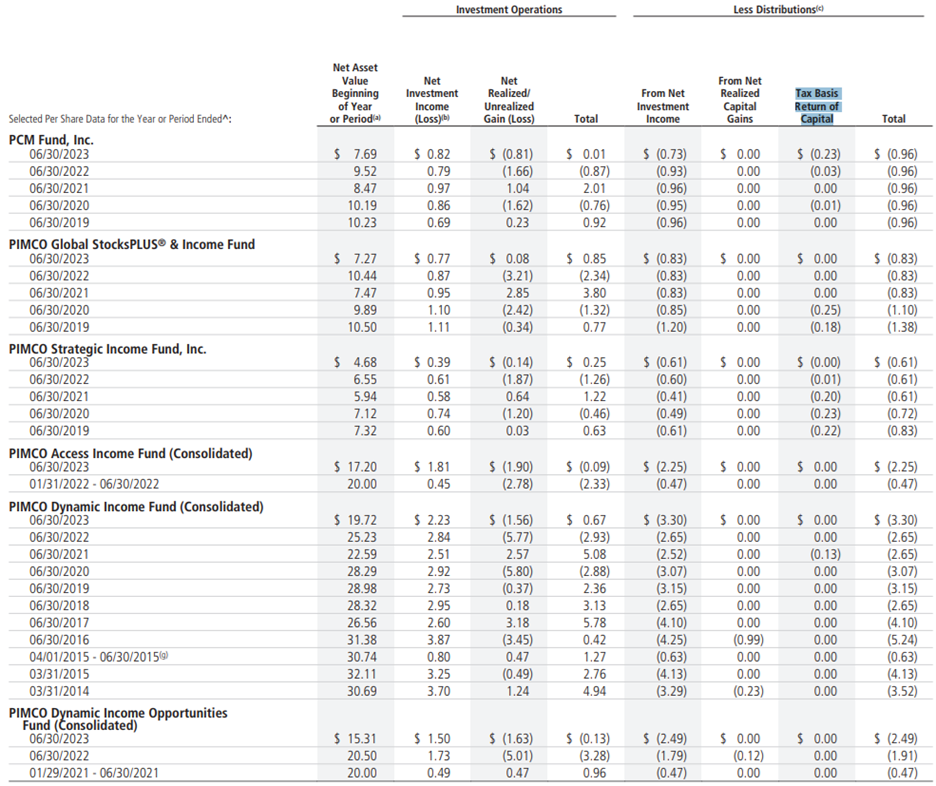
source: PDI Annual Report
PDI has been able to maintain a higher yield than other bond CEFs through a combination of relatively high leverage (or borrowed money), lower rated holdings (the higher the risk, the higher the return, generally speaking) and through extensive use of derivates (such as interest rate swaps). All of these things come with risk (which PIMCO, the premier bond fund manager, may be better equipped to handle than its peers).
The Bottom Line:
Despite the risks and market volatility, PDI has delivered big steady monthly income payments to investors since its inception. And despite the risks (such as leverage, price premium (versus NAV), holdings trading at discounts to par (potentially a good thing)), PIMCO is the premier bond fund manager and well equipped to deal with the challenges.
From our perspective, we do currently own shares of PDI in our Blue Harbinger “High Income NOW” Portfolio. However, it is not the only bond CEF we own (we also own BlackRock funds too), and it is not even one of the biggest bond CEFs we own. You can view the complete holdings (in our “High Income NOW” Portfolio) here.
However, at the end of the day, it’s critically important you only invest in things that are right for you—based on your own personal situation. Disciplined, goal-focused, long-term investing continues to be a winning strategy.